As August came to an end, crypto trust Grayscale scored a win in its case against the SEC concerning the conversion of GBTC into a spot ETF. This positive development soon pushed the BTC price above $28,000, a rapid surge of 6%. Moreover, this legal victory also drove up the stagnant prices that had gripped the crypto market for the past two weeks, providing some relief to a struggling industry.
The price performance of Bitcoin, the No.1 crypto, is naturally a trending topic among investors. That said, it is myopic to focus solely on prices, which is true for both investors and miners. As a crucial metric, prices are influenced by a wide range of factors. Therefore, to fully understand a crypto’s performance, we should also examine its on-chain statistics. Today, let’s dive into the on-chain data of Bitcoin to check out how it really performed in August.
Trading Volume
The number of Bitcoin transactions is a critical indicator of network activity. According to THE BLOCK, around 14.06 million Bitcoin transactions occurred in August, with a total value of approximately $693.2 billion. Compared to the figures recorded in July, the number of Bitcoin transactions and their combined transaction value dropped by 0.49% and 5.28% month on month, respectively.
The decline in Bitcoin’s trading volume in August can be attributed to the uncertainty surrounding new crypto regulations: Many investors adopted a cautious approach, awaiting the SEC’s decision on the Bitcoin spot ETF.
Exchange Inflow
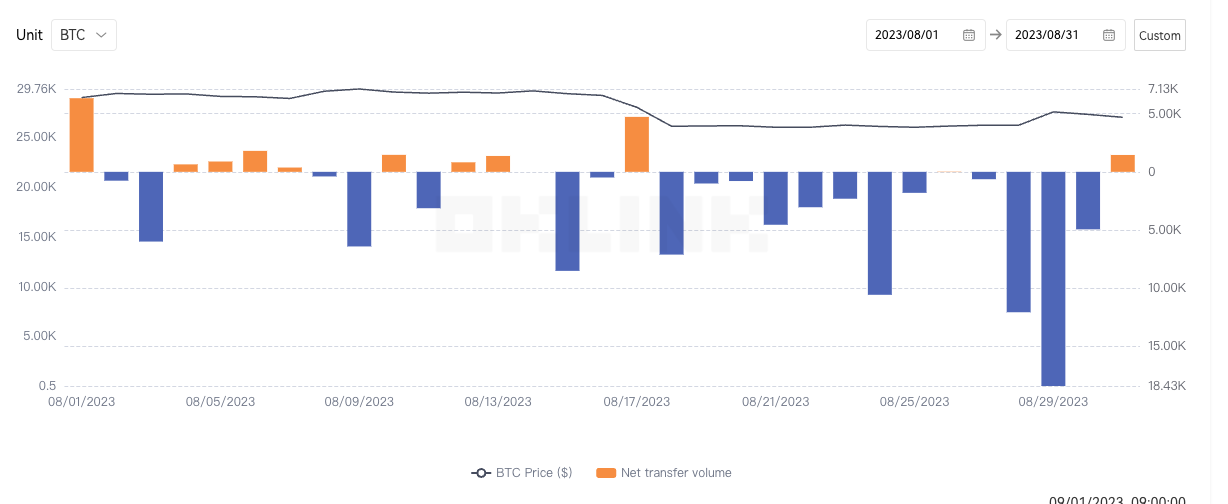
As crypto exchanges represent a key bridge between crypto assets and fiat services, exchange inflow offers us insights into the overall investor sentiment and market trends. Positive inflows indicate that coins are entering exchanges, and the low market confidence may trigger small-scale dumping. Negative inflows, on the other hand, signify that coins are leaving exchanges, which is a sign of optimism, i.e., many investors plan to hold the crypto for an extended period.
According to OKLINK, in August, all the BTC addresses owned by exchanges recorded negative inflows on 19 days and positive inflows on only 11 days. Meanwhile, many Bitcoin holders also decided to cash out: a total of 73,100 bitcoins were sold in August.
Average Bitcoin Cost
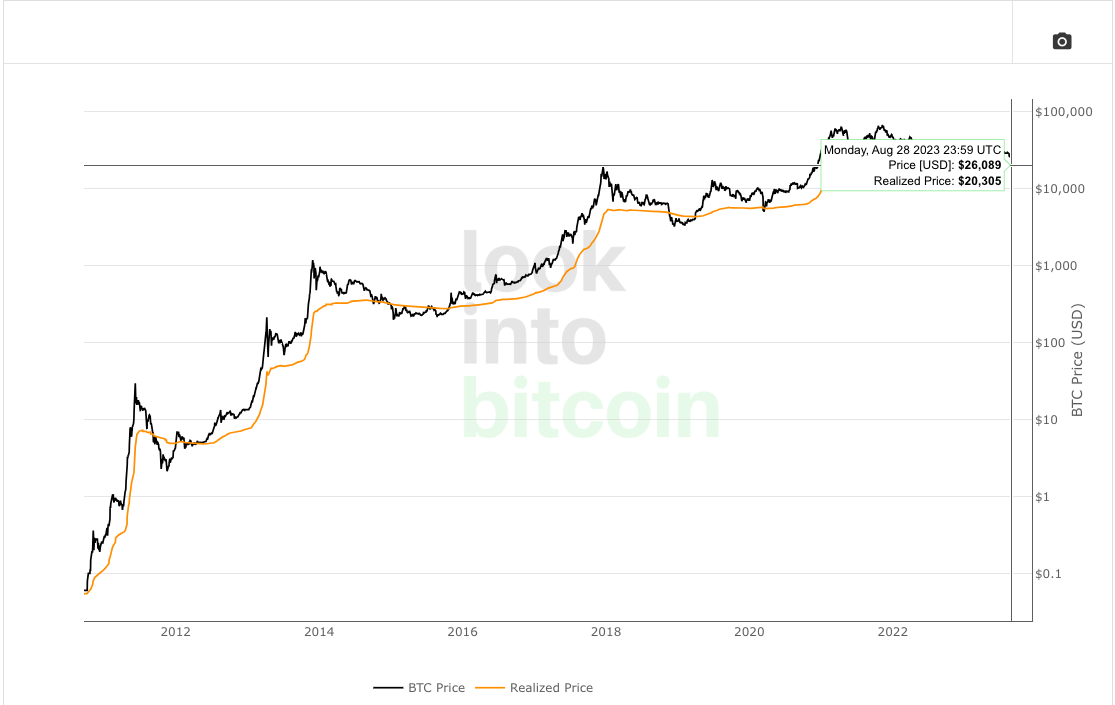
Bitcoin’s realized price is the value of all bitcoins at the price they were last transacted on-chain, divided by the number of bitcoins in circulation. This gives us the average cost at which all bitcoins were purchased.
Data from lookintobitcoin shows the average cost of Bitcoin stood at $20,293 on August 31st, lower than the current market price of $27,306. Buying Bitcoin at the market price is clearly not the best bargain, as it is higher than the average cost of purchase.

BTC Hashrate
Hashrate measures the processing capacity of a computer or network. It shows us the number of cryptographic hash operations a computer or network can perform within a specific time frame. A high BTC hashrate typically reflects great confidence in Bitcoin and thus attracts more miners. It shows us that the market has faith in Bitcoin’s future development and long-term value.
In August, the Bitcoin hashrate saw huge fluctuations. While it reached a historic high of 417 EH/s on August 18, the figure quickly declined afterward. This might be associated with the drop in the BTC hash price, which prompted some miners with high costs to suspend their operations.
Hash Price
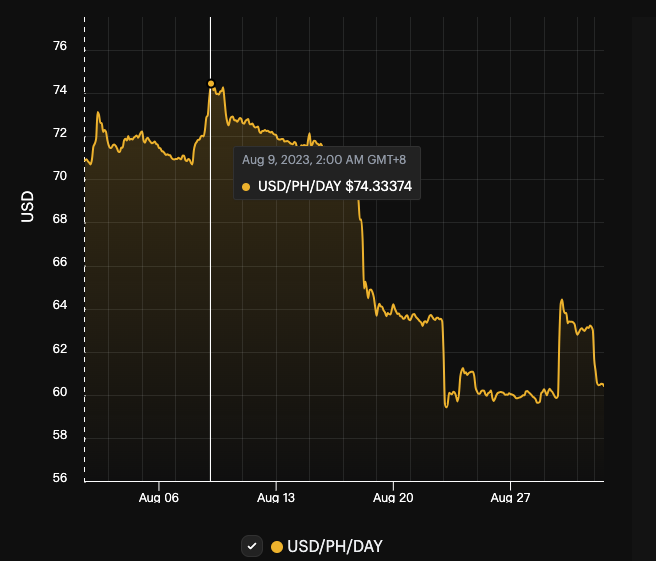
Hash price refers to the market value of each unit of hashing power. Typically measured in USD/unit of hashing power, hash price is a key metric for miners, as it allows them to assess the profitability of their current mining operations.
Data from HASHRATE INDEX shows that Bitcoin’s hash price plummeted in August, dropping from the peak of $74.33/PH/day at the beginning of the month to $60.54/PH/day. As a result, the BTC miner revenue went down by 9.01% in August month on month.

Revenue of Mainstream Mining Rigs
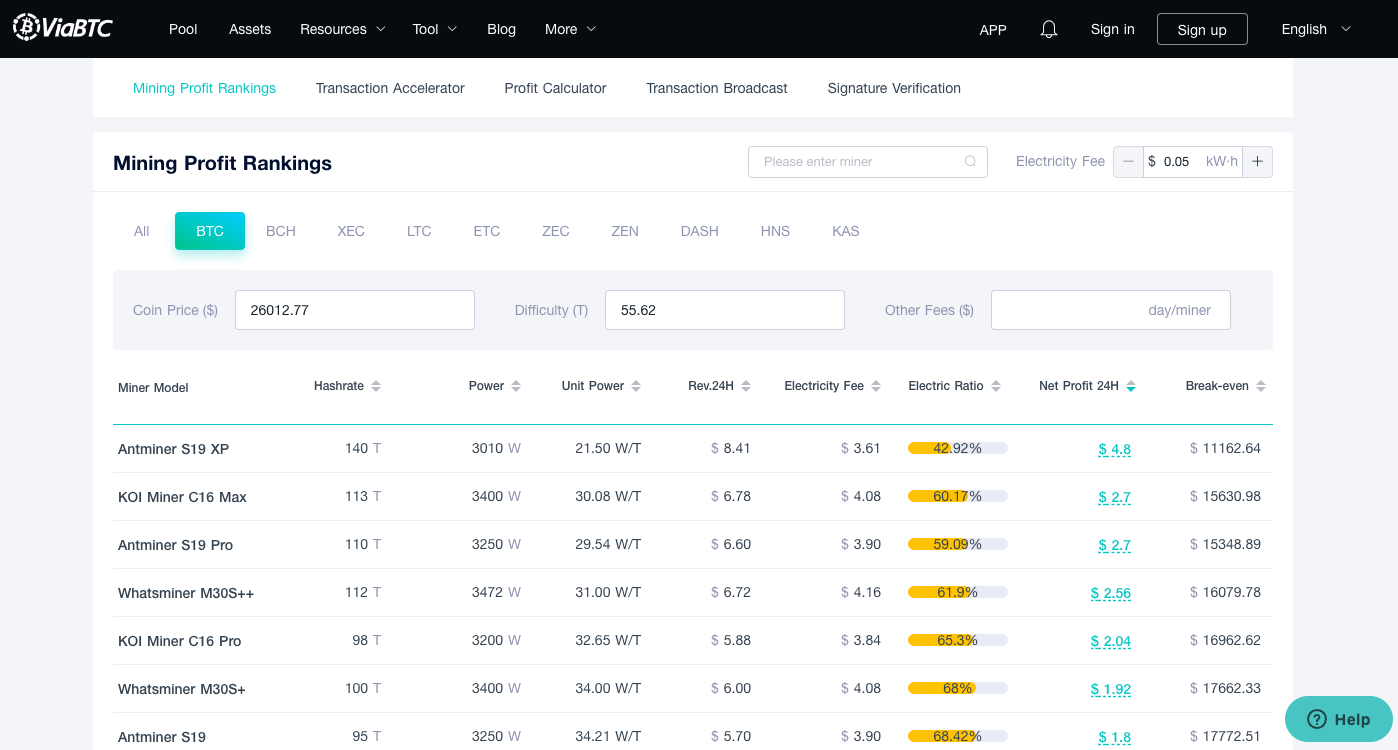
Profit calculators of BTC mining rigs provide insights into the current output of different ASIC miners. In addition, the BTC price may be nearing a bottom when mining rigs approach their shutdown price.
Let’s check out the mining revenue of mainstream ASIC miners calculated by ViaBTC at the electricity price of $0.05 per kWh:
 Link: https://www.viabtc.com/tools/miner
The shutdown price of top-tier models is around $10,000. However, older models are not doing so well. For instance, ANTMINER S17, which was the best mining rig in 2019, now features a shutdown price of nearly $23,000 and is about to be outdated.
To sum up, Bitcoin underperformed in August in terms of price or any other on-chain metric, but it is important to note that figures recorded in a single month cannot represent broader market trends. Aside from that, we should be aware that as the next Bitcoin halving fast approaches, the current period can be quite challenging for the crypto market.
* Disclaimer: The article offers no financial advice.